 | Gauhati University B.Com 3rd Sem CBCS Pattern")
Gauhati University B.Com 3rd Sem CBCS Pattern
4 (SEM-3/CBCS) HG 1/HG 2
2021 (Held in 2022)
COMMERCE (Honours Generic)
OPTION – A
Paper: COM-HG-3016
(Business Statistics)
Full Marks: 80
Time: Three hours
The figures in the margin indicate full marks for the questions.
Answer Questions Nos. 1, 2, 3 and any four from the rest.
1. (a) Select the correct answer: 1×4=4
Sum of the squares of deviations of the given set of observations from their arithmetic means is
Maximum.
Minimum.
Zero.
None of the above.
Standard deviation is dependent on the change of
Origin.
Scale.
Origin and scale.
None of the above.
Seasonal variations are
Short-term variations.
Long-term variations.
Sudden variations.
Cyclical variations.
Coefficient of variations is calculated by the formula
.
.
.


Ans:-

(b) Fill in the blanks: 1×3=3
1.An index number is a special type of statistical measure.
2.Correlation coefficient is indipendent of two regression coefficients.
3.If A and B are mutually exclusive events, 0

(c) Write True or False: 1×2=2
An average alone is sufficient to understand the basic characteristics of a frequency distribution. False
Mean of binomial distribution is always greater than variance. False
(d) What do you mean by sample? 1
2. Answer the following questions: 2×5=10
A) What is estimation?
Ans:- Estimation in statistics means making educated guesses about population characteristics using sample data.
B)Write two properties of correlation coefficient.
Ans :- Correlation Coefficient Properties:
- Range: Correlation coefficient "r" ranges from -1 to 1.
- Independence of Scale: "r" is not affected by changing the units of measurement.
Gauahti University BCom 3rd Sem Business Statistics Solved Question Paper 2021
C)Two regression coefficients in a distribution are calculated as – 1.89 and – 0.52. Is it possible? Justify your answer.
Answers:- Yes, it's possible for regression coefficients to be negative (-1.89 and -0.52) depending on the relationship between variables.
D) Define skewness.
Ans:- Skewness: Skewness measures the asymmetry in a data distribution - positive skew (right-heavy), negative skew (left-heavy), or zero skew (symmetrical).
3. Answer any four of the following questions: 5×4=20
What is sample survey? Write the advantages and disadvantages of sample survey.
A sample survey is a research method used in statistics to gather information or data from a subset (sample) of a larger population. The primary goal of a sample survey is to make inferences and draw conclusions about the entire population based on the data collected from the sample. Here are the advantages and disadvantages of using sample surveys:
Advantages:
Cost-Efficiency: Conducting a survey on the entire population can be expensive and time-consuming, while sampling is more cost-effective.
Time-Saving: Surveys can be completed more quickly when dealing with a sample, allowing for faster data collection and analysis.
Practicality: In some cases, it may be impossible or impractical to survey an entire population, making sampling the only feasible option.
Reduced Data Collection Errors: Managing a smaller sample is often more accurate and involves fewer errors than dealing with a large population.
Disadvantages:
Sampling Error: There is a potential for sampling error, which occurs when the sample does not perfectly represent the population due to random variation.
Bias: If the sampling process is biased or not random, it can lead to non-representative samples, causing inaccurate conclusions.
Limited Generalization: Findings from a sample may not generalize well to the entire population, especially if the sample is not carefully chosen.
Lack of Detailed Information: Sampling might not provide detailed information about subgroups within the population if the sample size is small.
Sampling Frame Issues: Choosing a representative sample relies on having an accurate and up-to-date list of the population (sampling frame), which can be challenging to obtain.
Prove that the expectation of a random variable x is equal to the arithmetic mean.
Ans:- The expectation (or expected value) of a random variable X, denoted as E(X), is indeed equal to the arithmetic mean (average) of the values of X. Mathematically:
E(X) = (Σ [xi * P(xi)]) for all possible values xi of X
In simple terms, you multiply each possible value of X by its corresponding probability of occurrence (P(xi)) and sum up these products. This calculation effectively computes the weighted average of X, which is the arithmetic mean
Discuss briefly various problems involved in the construction of index numbers.
Ans:- Problems in the Construction of Index Numbers:
The construction of index numbers can pose several challenges, including:
Base Year Selection: Selecting an appropriate base year is crucial, and choosing an outdated or biased base year can lead to inaccurate index values.
Selection of Weights: Assigning weights to different components in the index requires careful consideration. Choosing inappropriate weights can result in a misleading index.
Quality and Availability of Data: Availability of high-quality data on prices and quantities for various items can be a problem, especially in developing economies.
Substitution Bias: If consumers substitute one good for another when prices change, but the index does not account for this substitution, it may overstate inflation.
New Products and Quality Changes: Incorporating new products and accounting for changes in product quality over time can be challenging.
Seasonal Effects: Seasonal variations in prices can affect index numbers. Adjusting for seasonality is important for accurate measurement.
Weight Updating: Periodically updating the weights to reflect changing consumption patterns is essential for the relevance of an index.
Laspeyres and Paasche Index Issues: Deciding whether to use a Laspeyres (fixed-base) or Paasche (current-base) index depends on the context, and both have their limitations.
Addressing these problems requires careful methodology, data collection, and analysis to ensure that index numbers accurately reflect the changes in the prices or quantities of goods and services over time.
Given the two regression equations as follows: and . Find the correlation coefficient between x and y.


Solution:-

State the additive law of probability and explain it with an example.
Ans:- The additive law of probability, also known as the union rule, states that the probability of either of two mutually exclusive events occurring is the sum of their individual probabilities.
Mathematically, for two events A and B:
P(A or B) = P(A) + P(B)
Where:
- P(A or B) is the probability that either event A or event B occurs.
- P(A) is the probability of event A occurring.
- P(B) is the probability of event B occurring.
Example:
Consider rolling a fair six-sided die. Event A is getting an even number (2, 4, or 6), and event B is getting an odd number (1, 3, or 5). Since these events are mutually exclusive (you can't roll both an even and an odd number simultaneously), you can use the additive law of probability.
P(A) = Probability of getting an even number = 3/6 = 1/2
P(B) = Probability of getting an odd number = 3/6 = 1/2
Now, to find the probability of rolling either an even or an odd number:
P(A or B) = P(A) + P(B) = 1/2 + 1/2 = 1
So, the probability of rolling either an even or an odd number on a fair six-sided die is 1, which means it is certain that one of these events will occur when you roll the die.
What do you mean by correlation between two variables? Mention different types of correlation.
Ans:- Correlation between two variables refers to a statistical relationship or association that exists between them. In other words, it indicates how changes in one variable are related to changes in another. Correlation does not imply causation, meaning that even if two variables are correlated, it does not necessarily mean that one causes the other.
There are different types of correlation, including:
1. Positive Correlation: In a positive correlation, as one variable increases, the other also increases. Conversely, as one variable decreases, the other also decreases. For example, there is a positive correlation between the number of hours spent studying and exam scores - typically, the more you study, the higher your scores.
2. Negative Correlation: In a negative correlation, as one variable increases, the other decreases, and vice versa. An example is the relationship between the amount of exercise and body weight. Generally, the more you exercise, the lower your body weight.
3. No Correlation (Zero Correlation): When two variables are not related, or there is no discernible pattern between them, they are said to have no correlation. Changes in one variable do not predict or affect changes in the other. An example might be the relationship between shoe size and exam scores - there is typically no correlation between these two variables.
4. Strong Correlation: If the relationship between two variables is very consistent and the data points cluster closely to a straight line, it's considered a strong correlation. This implies that one variable is a good predictor of the other.
5. Weak Correlation: A weak correlation means that there is a relationship between the variables, but it is not very consistent or reliable. The data points are more scattered, and it's harder to predict one variable based on the other.
6.Perfect Correlation: In a perfect correlation, all data points fall exactly on a straight line. This indicates a precise and predictable relationship between the variables. However, perfect correlations are quite rare in real-world data.
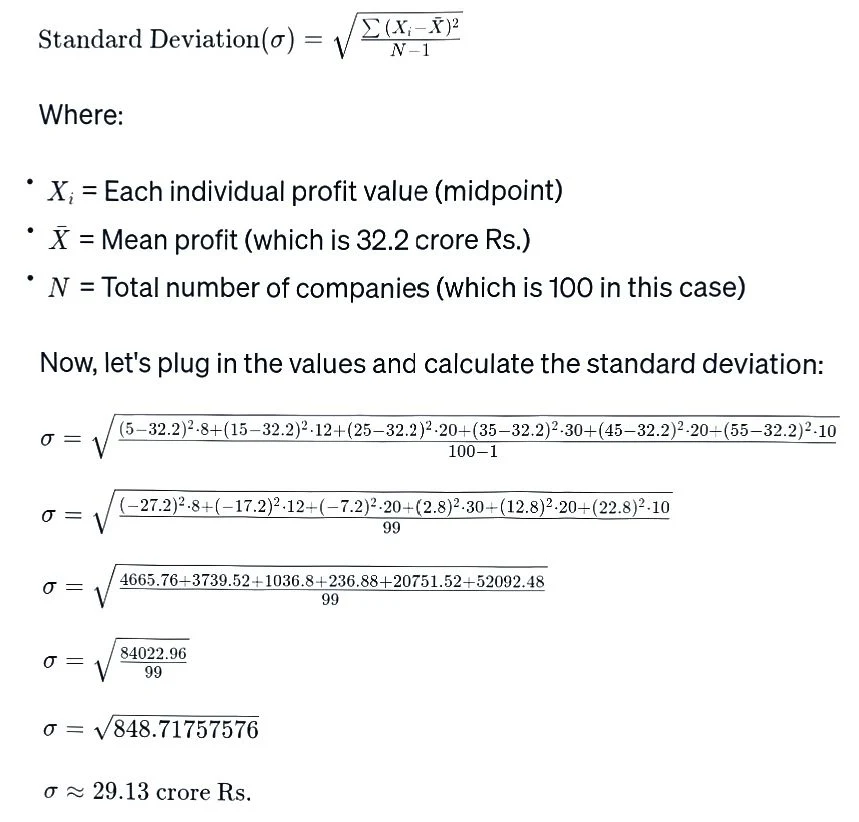
4. (a) A study of 100 companies gives the following information:
Calculate mean and standard deviation of the profit earned. 3+3=6
Solution:-
Mean Profit = [(5 crore * 8 companies) + (15 crore * 12 companies) + (25 crore * 20 companies) + (35 crore * 30 companies) + (45 crore * 20 companies) + (55 crore * 10 companies)] / 100 companies
Mean Profit = [40 crore + 180 crore + 500 crore + 1050 crore + 900 crore + 550 crore] / 100 companies
Mean Profit = (3220 crore) / 100 companies
Mean Profit = 32.2 crore Rs.
(b) Mention the desirable properties of a good measure of dispersion. 4
Ans:- A good measure of dispersion (also known as a measure of variability or spread) should possess several desirable properties to effectively convey the degree of variation or dispersion in a dataset. Here are four desirable properties of a good measure of dispersion:
Sensitivity to Variability: A good measure of dispersion should be sensitive to variations in the data. In other words, it should reflect the extent to which data points deviate from the central tendency (e.g., mean or median). If the data exhibits substantial spread, the measure should provide a larger value to indicate this, and if the data has less variability, it should yield a smaller value.
Non-Negativity: The measure of dispersion should always yield a non-negative value. Since dispersion is a measure of spread, it cannot be negative. This property ensures that the measure is mathematically meaningful and interpretable.
Relative Interpretability: A good measure of dispersion should be interpretable in the context of the data. This means that the value of the measure should be meaningful and easy to understand. For example, in the context of profit, a dispersion measure in terms of the same units (e.g., currency) is more interpretable than a measure in abstract units.
Efficiency: The measure should efficiently capture dispersion without being unduly influenced by outliers or extreme values. It should provide a balanced representation of the entire dataset's variability. Measures like the standard deviation or interquartile range often possess this property as they are less affected by extreme values compared to the range.
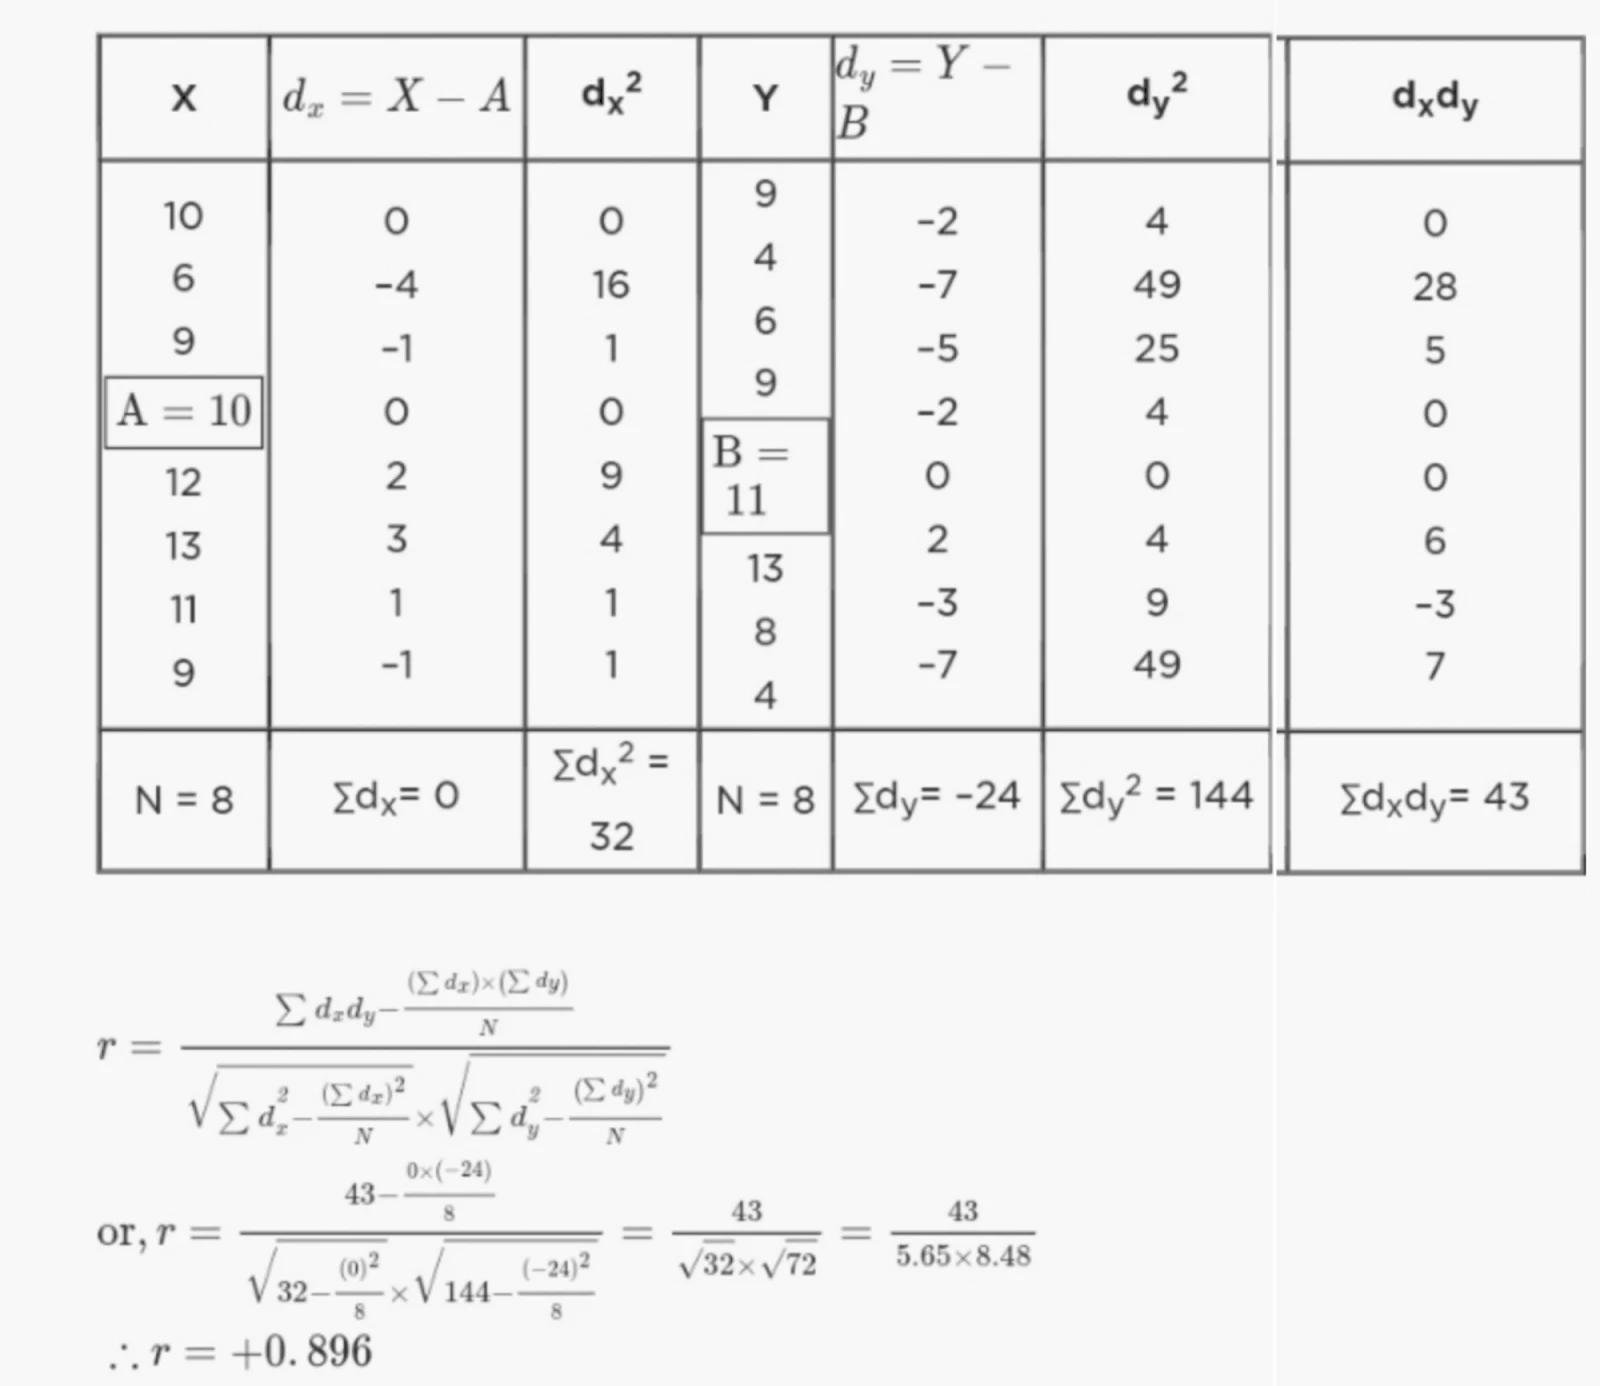
5. (a) Find the coefficient of correlation between X and Y from the following data: 6
Solution:-
(b) What is a regression line? What purpose does it serve? When are the two regression lines identical? 2+1+1=4
Ans:- Download PDF for Complete Solution of GU BCom 3rd Sem Business Statistics Question Paper 2021 (Held in 2022)
