
![GU Business Statistics Solved 2024 Question Paper [Gauhati University FYUGP BCom 3rd Semester]](https://blogger.googleusercontent.com/img/b/R29vZ2xl/AVvXsEj2BU470xCIR3oWhH_qYvAMmyKGsECxpH-xq5L_R_hHencjCw2DXzN9PQhpCLvoZV4d6a-ajd5NzmWKGw4vsZb3cCQjoSNvxw6C6vSdW2iO-SOUtu6_Cotl9cEohBGp-JOIG1-0WcB2ajAcfmbAFBg3bJAy_AhEUM2OntuZ3IMpYK63juUNR2bJ6vnQ94Ns/s16000-rw/1000315436.webp "GU Business Statistics Solved 2024 Question Paper [Gauhati University FYUGP BCom 3rd Semester]")
Gauhati University
FYUGP BCom 3rd Semester
Multidisciplinary Course
Business Statistics (MDC030403)
Full Marks: 45
Time: 2 hours
Answer either in English or in Assamese
1. Answer the following as directed: (1×5=5)
(a) Distinguish between univariate and bivariate data.
Answer: Univariate data involves only one variable and is used to describe a single characteristic or attribute.
Bivariate data involves two variables and is used to study the relationship or correlation between them.
(b) If A is a certain event in a random experiment, then P(A) = ____ (Fill in the blank)
Answer: P(A) = 1
(c) If r = ±1, then the two lines of regression are:
(i) Coincident (ii) Parallel (iii) Perpendicular (iv) None of the above
Answer: (i) Coincident
(d) Lockout in a factory for a month is associated with which component of a time series?
Answer: Irregular or Erratic Component
(e) What are the different kinds of error associated with tests of significance?
Answer:
The two types of errors are:
i) Type I Error – Rejecting a true null hypothesis.
ii) Type II Error – Accepting a false null hypothesis.
2. Answer the following questions: (2×5=10)
(a) Define null hypothesis.
Answer: A null hypothesis is a statistical hypothesis that assumes there is no significant difference or relationship between certain observed phenomena. It is denoted by H₀ and is tested for possible rejection in favor of an alternative hypothesis.
(b) Mention two properties of Karl Pearson’s correlation coefficient.
Answer:
i) The value of Karl Pearson’s correlation coefficient (r) lies between –1 and +1.
ii) It is independent of the origin and scale of the data.
(c) If A and B are not mutually exclusive events and P(A) = ¼, P(B) = ²⁄₅, P(A ∪ B) = ½, find P(A ∩ B).
Answer:
We use the formula:
P(A ∪ B) = P(A) + P(B) – P(A ∩ B)
Substitute the values:
½ = ¼ + ²⁄₅ – P(A ∩ B)
Convert to common denominators:
½ = 5/20 + 8/20 – P(A ∩ B)
½ = 13/20 – P(A ∩ B)
Now,
P(A ∩ B) = 13/20 – ½ = 13/20 – 10/20 = 3/20
Answer: P(A ∩ B) = 3⁄20
(d) What do you mean by skewness?
Answer: Skewness refers to the degree of asymmetry or departure from symmetry in the distribution of data. A distribution is positively skewed if it has a longer tail on the right and negatively skewed if it has a longer tail on the left.
(e) Find the harmonic mean of 2, 3, and 5.
Answer: Harmonic Mean (HM) =
Where n = 3, and the numbers are 2, 3, and 5
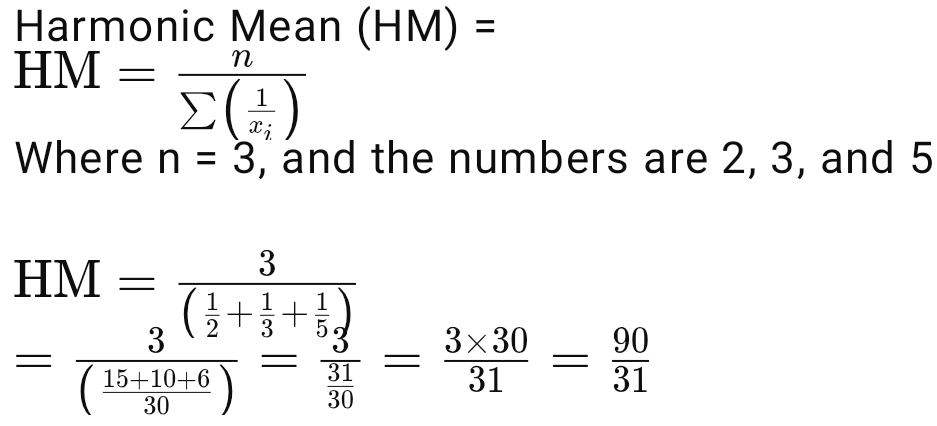
Answer: Harmonic Mean = 90⁄31 ≈ 2.90
3. Answer any four of the following questions: (5×4=20)
(a) AM = 9, GM = 7.2. Find HM and the two numbers.
Answer: Let the two numbers be x and y.
We know the following formulas:
i) Arithmetic Mean (AM) = (x + y)/2
ii) Geometric Mean (GM) = √(xy)
iii) Harmonic Mean (HM) = 2xy / (x + y)
Given:
AM = 9
⇒ (x + y)/2 = 9
⇒ x + y = 18
Given:
GM = 7.2
⇒ √(xy) = 7.2
⇒ xy = (7.2)² = 51.84
The values of x + y and xy to find HM
Now,
HM = 2xy / (x + y)
= (2 × 51.84) / 18
= 103.68 / 18
= 5.76
So, the Harmonic Mean is 5.76
We know:
x + y = 18
xy = 51.84
Now form the quadratic equation:
t² – (x + y)t + xy = 0
⇒ t² – 18t + 51.84 = 0
Solve this using quadratic formula:
t = [18 ± √(18² – 4×1×51.84)] / 2
= [18 ± √(324 – 207.36)] / 2
= [18 ± √116.64] / 2
= [18 ± 10.8] / 2
So, the two numbers are:
(18 + 10.8)/2 = 28.8/2 = 14.4
(18 – 10.8)/2 = 7.2/2 = 3.6
Final Answer:
The Harmonic Mean = 5.76
The two numbers are 14.4 and 3.6
(b) Find the missing frequency (median = 24):
Answer: DOWNLOAD PDF FOR COMPLETE SOLUTION
(c) What is time series? Give two examples. What are its components? (1+2+2=5)
Answer: A time series refers to a sequence of data points that are collected or recorded at successive points in time, usually at equal intervals such as daily, weekly, monthly, or yearly. It helps in analyzing how a particular variable changes over time and is widely used in fields like economics, business, weather forecasting, and statistics.
Examples of time series:
i) The monthly sales of a retail store over one year.
ii) The yearly population of a country over the last ten years.
Components of a time series:
i) Trend (T): This refers to the long-term movement or direction in the data over a period of time. It can be upward (increasing), downward (decreasing), or stagnant (constant). For example, the steady increase in the number of vehicles over the years shows an upward trend.
ii) Seasonal Variation (S): These are short-term, repetitive fluctuations that occur at regular intervals due to seasonal factors like climate, festivals, or holidays. For example, increased sales of fans during summer.
iii) Cyclical Variation (C): These are long-term oscillations that occur due to business cycles like boom and recession. They do not follow a fixed period but usually repeat over several years.
iv) Irregular or Random Variation (I): These are unpredictable or accidental variations that occur due to unforeseen events like natural disasters, strikes, pandemics, etc.
By analyzing the time series and its components, future trends and patterns can be forecasted and better decisions can be made.
(d) Define mathematical probability. Mention drawbacks. (3+2=5)
Answer: Mathematical probability, also known as classical probability, is the numerical measurement of the likelihood that an event will occur. It is based on the assumption that all outcomes in a sample space are equally likely.
The formula for mathematical probability is:
P(E) = Number of favorable outcomes/Total number of equally likely outcomes
Where:
Probability of the event E
Favorable outcomes = outcomes that satisfy the event
Total outcomes = all possible outcomes in the experiment
Example: If a die is rolled once, the probability of getting a 4 is:
P(4) = 1/6
Because there is 1 favorable outcome (getting a 4) out of 6 equally likely outcomes (1 to 6).
Drawbacks of mathematical probability:
i) Assumption of equally likely outcomes: This method works only when outcomes are equally likely. In real-life situations, especially in social sciences or natural events, outcomes are not always equally likely.
ii) Not applicable to all situations: It cannot be applied to situations where past data or theoretical assumptions about equally likely outcomes are not available. For example, we cannot use mathematical probability to find the chance of rainfall tomorrow without meteorological data.
Hence, although mathematical probability is easy to calculate, it has limited application in real-world uncertain situations.
(e) What is sample survey? Distinguish from census survey. (2+3=5)
Answer: A sample survey is a statistical method in which data is collected from a small part or sample of the population to make generalizations or conclusions about the entire population. This method is used when studying the whole population is not practical due to time, cost, or effort constraints.
For example: To know the opinion of students in a university, a sample of 200 students may be selected from a total of 5000 students.
Difference between Sample Survey and Census Survey:
In conclusion, sample surveys are widely used in research, opinion polls, and large-scale studies, whereas census surveys are used when 100% accuracy is required.
(f) What is Poisson distribution? Mention basic features. (2+3=5)
Answer: Poisson distribution is a type of probability distribution that shows how many times an event is likely to occur within a fixed interval of time or space when the events occur independently and at a constant average rate.
It is used when the number of trials is large, the probability of success is small, and the events are rare but possible.
Where:
= Probability of x events occurring
= Mean number of occurrences
= Euler’s number (approximately 2.718)
= Actual number of occurrences
= Factorial of x
Basic features of Poisson distribution:
i) It is a discrete distribution: The variable x can take only non-negative integer values (0, 1, 2, ...).
ii) Used for rare events: It is useful in predicting rare events like the number of telephone calls per minute at a call center, number of typing errors per page, etc.
iii) Mean and variance are equal: In Poisson distribution, the mean (m) and the variance are numerically equal.
iv) Events are independent: The occurrence of one event does not affect the occurrence of another.
v) No upper limit: There is no maximum value for x; it can go up to infinity, though the probability becomes very small for large x.
(g) Calculate Karl Pearson’s correlation from:
x: 1 2 3 4 5 6 7
y: 3 5 6 8 10 11 13
(h) Given:
Correlation coefficient = 0.66
Find the regression line of y on x.
Answer: DOWNLOAD PDF FOR COMPLETE SOLUTION
4. Answer any one of the following questions: (10 marks)
(a) (i) Define correlation between two variables. Explain types with examples. (2+4=6)
(ii) Given:
n = 15, x̄ = 25, ȳ = 18
Σ(x − x̄)² = 136, Σ(y − ȳ)² = 138
Σ(x − x̄)(y − ȳ) = 122
Find rₓᵧ (4 marks)
(b) (i) Using 3-yearly moving average, calculate the trend from the following:
b)(ii) Write a short note on any one: (3 marks)
(1) Seasonal Variation
Answer: Seasonal variation refers to short-term, repetitive changes in a time series that occur at regular intervals due to seasonal or climatic factors. These variations are predictable and repeat every year or within a year, such as quarterly or monthly.
Examples:
Increase in ice cream sales during summer
Higher shopping during festivals like Diwali or Christmas
Seasonal variation helps businesses prepare for periodic demand changes, manage inventory, and plan marketing strategies accordingly.
(2) Uses of Time Series Analysis
Answer: Time series analysis is used to study how data changes over time and to predict future trends.
Main uses include:
i) Forecasting: Helps in predicting future values like sales, population, or rainfall.
ii) Business Planning: Useful in budgeting, production planning, and manpower planning.
iii) Identifying Patterns: It shows trends, seasonal effects, or sudden changes.
iv) Policy Making: Governments and organizations use it for economic and social planning.
Time series analysis is a powerful tool in statistics, economics, finance, and business.
(c) (i) What is the probability that a non-leap year has 53 Saturdays? (4 marks)
Answer: A non-leap year has 365 days.
365 days = 52 weeks + 1 day
So, in every non-leap year, there are 52 full weeks, meaning every day of the week (Sunday to Saturday) will occur 52 times.
But there is 1 extra day left. That extra day can be any one of the 7 days of the week.
So, for 53 Saturdays to occur, the extra day must be a Saturday.
Total possible extra days = 7 (Sunday to Saturday)
Favorable outcome = 1 (only Saturday)
Probability = Favorable outcomes/Total outcomes = 1/7
Final Answer: The probability that a non-leap year has 53 Saturdays is 1⁄7.
(ii) State three properties of normal distribution. (3 marks)
Answer: Three important properties of normal distribution are:
Symmetrical Bell Shape:
The normal distribution is perfectly symmetrical around its mean. The left and right halves are mirror images.Mean = Median = Mode:
All three measures of central tendency are equal and located at the center of the distribution.Total Area Under Curve = 1:
The area under the normal curve represents probability, and it always adds up to 1 (or 100%).
These properties make the normal distribution very useful in statistics and data analysis.
(iii) Two dice are thrown. Find the probability that the sum ≥ 9. (3 marks)
Answer: When two dice are thrown, total number of outcomes = 6 × 6 = 36
We list the outcomes where the sum is 9 or more:
Sum = 9: (3,6), (4,5), (5,4), (6,3) → 4 outcomes
Sum = 10: (4,6), (5,5), (6,4) → 3 outcomes
Sum = 11: (5,6), (6,5) → 2 outcomes
Sum = 12: (6,6) → 1 outcome
Total favorable outcomes = 4 + 3 + 2 + 1 = 10
Probability = Favorable outcomes/Total outcomes = 10/36 = 5/18²
Final Answer: The probability that the sum is greater than or equal to 9 is 5⁄18.
(d) (i) From the data below, calculate mean and variance (3+4=7)
Answer: DOWNLOAD PDF FOR COMPLETE SOLUTION
(ii) Write a short note on any one: (3 marks)
(1) Simple Random Sampling Method
Definition: Simple Random Sampling is a method of selecting a sample from a population in such a way that each and every unit has an equal and independent chance of being selected.
Key Features:
Each item in the population has the same probability of being included.
It eliminates personal bias.
Selection can be done by lottery method or using random number tables or software.
Advantages:
Easy to understand and apply
Unbiased representation of the population
Theoretically sound and fair
Limitations:
Not practical for large populations without a complete list
Random selection may lead to unrepresentative samples by chance
(2) Test of Significance
Definition: A test of significance is a statistical tool used to decide whether the observed difference between sample statistics and population parameters (or between two samples) is due to chance or statistically significant.
Purpose:
To test hypotheses
To make decisions or inferences about populations based on sample data
Common Tests:
Z-test: used when sample size is large
t-test: used when sample size is small
Chi-square test: used for categorical data
Steps Involved:
State the null hypothesis (H₀) and alternative hypothesis (H₁)
Choose significance level (like 5% or 1%)
Calculate test statistic
Compare with critical value
Take decision: accept or reject H₀
Conclusion: Tests of significance help in making scientific conclusions using sample data and in controlling errors in decision-making.
(3) Scatter Diagram
Definition: A scatter diagram (or scatter plot) is a graphical tool used to study the relationship between two quantitative variables. It shows data as a collection of points plotted on the Cartesian plane.
How it works:
One variable is plotted on the X-axis, the other on the Y-axis
Each point represents one observation (x, y)
Uses:
To identify the type of correlation:
Positive correlation (points go upward)
Negative correlation (points go downward)
No correlation (points are scattered randomly)
To see if a linear relationship exists
It is a preliminary tool before calculating the correlation coefficient
Example: If we plot marks in Maths (X) vs. marks in Science (Y) for a group of students, a clear upward trend in points may show positive correlation.
Conclusion: Scatter diagrams are easy to draw and help visually understand how two variables are related.
-0000-
Must Visit: GU FYUGP BCom 3rd Sem Main Page, Solved Papers, Notes
FAQs – Business Statistics Question Solved Paper 2024 (GU B.Com 3rd Semester)
Q1. Who can use this Business Statistics Question Paper 2024?
Ans: This question paper is useful for FYUGP B.Com 3rd Semester students of Gauhati University from all majors.
Q2. Is this question paper based on the NEP syllabus?
Ans: Yes, the question paper is based on the new NEP (National Education Policy) 2020 framework followed by Gauhati University.
Q3. Can I use this GU Business Statistics Solved paper for exam preparation?
Ans: Absolutely. This paper helps you understand the question pattern, marking scheme, and frequently asked questions.
Q4. Is the PDF free to download?
Ans: Yes, the PDF of the 2024 Business Statistics Solved question paper is shared free of cost for academic purposes.
Q5. Does this paper include all sections (MCQ, short, and long questions)?
Ans: Yes, it includes all parts of the question paper as per the official format of Gauhati University.
Last Word
The Business Statistics Solved Question Paper 2024 for Gauhati University B.Com FYUGP 3rd Semester is a helpful resource for understanding the paper structure and revising important topics. Make sure to download and practice this paper before your exam. Stay tuned for more past papers, answer keys, and study materials to boost your preparation. All the best.
![GU Business Statistics Solved 2024 Question Paper [Gauhati University FYUGP BCom 3rd Semester]](https://blogger.googleusercontent.com/img/b/R29vZ2xl/AVvXsEj2BU470xCIR3oWhH_qYvAMmyKGsECxpH-xq5L_R_hHencjCw2DXzN9PQhpCLvoZV4d6a-ajd5NzmWKGw4vsZb3cCQjoSNvxw6C6vSdW2iO-SOUtu6_Cotl9cEohBGp-JOIG1-0WcB2ajAcfmbAFBg3bJAy_AhEUM2OntuZ3IMpYK63juUNR2bJ6vnQ94Ns/w200-h200-p-k-no-nu/1000315436.webp)